Generate a Scatterplot of the Earth Similarity Index (ESI)
Source:R/scatterplot_esi.R
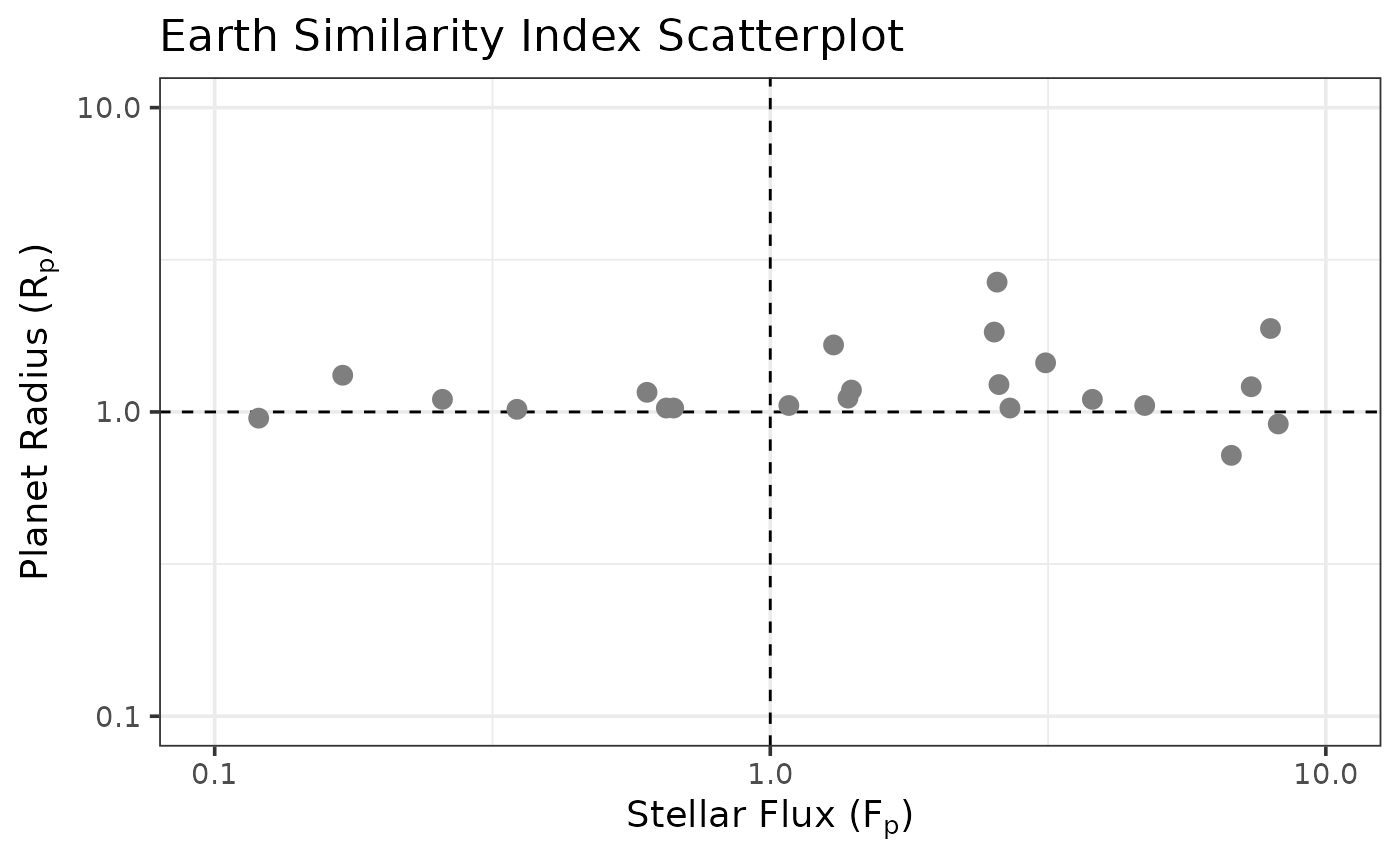
scatterplot_esi.RdCreates a log-log scatterplot of planetary radius versus stellar flux, colored by the Earth Similarity Index (ESI).
Usage
scatterplot_esi(data, plot_limits = c(0.1, 10))Arguments
- data
A data frame containing exoplanet data. Must include the columns:
pl_insol: incident stellar flux (in Earth flux units),pl_rade: planetary radius (in Earth radii),esi: Earth Similarity Index (numeric).
- plot_limits
A numeric vector of length 2 specifying the lower and upper bounds. Default is
c(0.1, 10).
Examples
# \donttest{
closest_50_exoplanets |>
  dplyr::mutate(esi = calculate_esi(radius = pl_rade, flux = pl_insol)) |>
  scatterplot_esi()
#> Warning: Removed 28 rows containing missing values or values outside the scale range
#> (`geom_point()`).

# }
# }